What is a local rank grid? How to read one in 2026
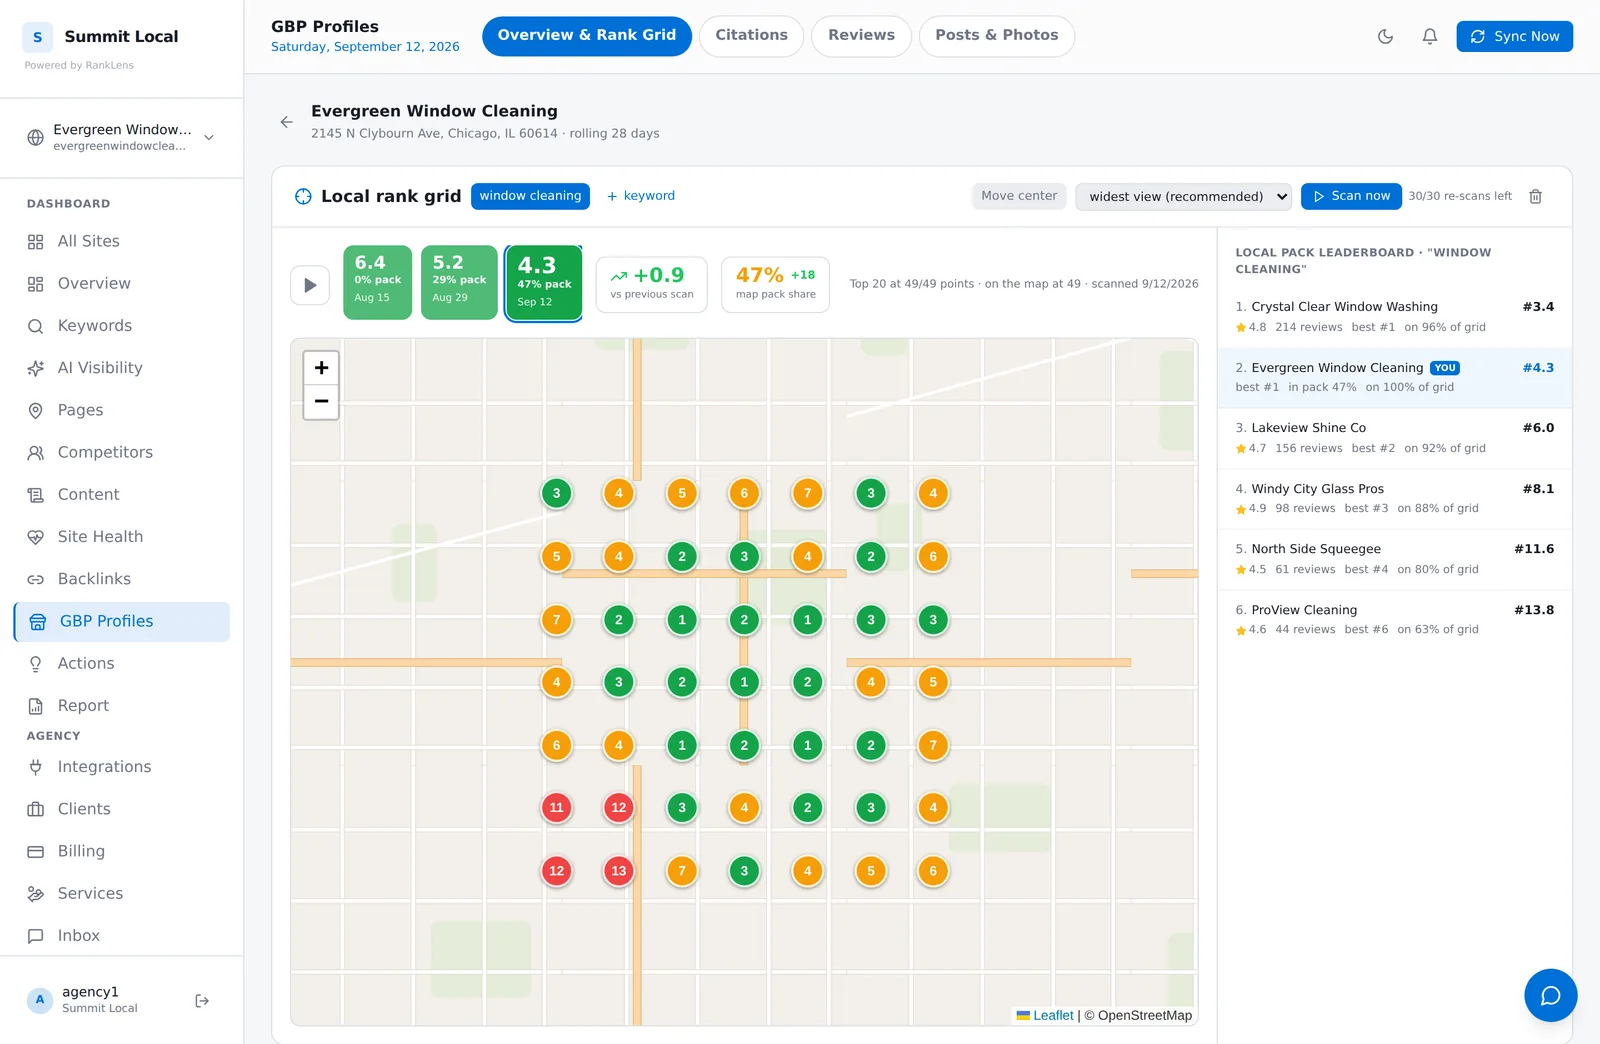
A local rank grid (also called a geogrid) is a map of your Google Maps ranking measured from many points across your service area at once. The tool runs the same search - say "window cleaning" - as if standing at each point of a grid laid over your town, records where your business ranks at each spot, and paints the result: green where you rank in the top 3, amber in the middle, red where you're invisible.
It exists because the single rank number most tools report is close to meaningless for a local business. Google Maps results are distance-weighted: you might be #1 next to your office and #14 two miles away, where most of your customers actually live. One number can't show that. A grid can.
How to read a rank grid
Four things, in order:
- The green blob is your real service radius. Wherever the grid is green, you're in the map pack and the phone can ring. That shape - not your city's border - is where you currently compete.
- The red edge is your growth map. A red cluster around a suburb you serve is a named, specific problem: Google doesn't associate you with that area. The usual causes are no page for that suburb, no reviews mentioning it, and a competitor physically closer.
- The average position summarizes the trend. One number per scan - average rank across all points - is the honest version of "how are we doing", and its movement over months is what a report should show.
- The leaderboard names the enemy. Every scan of your rank is also a scan of everyone else's. Who holds the top 3 at the points you lose? Their rating, review count, and share of the map tell you what closing the gap requires.
What actually moves the grid
Twenty years of running our own service businesses taught us the short list. In rough order of impact:
- Proximity - the one factor you can't edit. Google favors businesses near the searcher, which is why the grid fades with distance from your address and why service-area businesses fight uphill at the edges.
- Review velocity and recency - Whitespark's 2026 local ranking factors survey puts review recency in the top five local factors. A steady drip of new reviews beats a big pile of old ones.
- Relevance signals - your primary GBP category, services listed on the profile, and a website page that actually talks about the service and the area.
- Behavioral signals - clicks to call, direction requests, photo views. A profile people interact with rises.
What a grid can't tell you
Honest limits, because you'll find them anyway: a grid measures the map pack, not organic web results - your website's rankings are a separate fight. Scans are snapshots, not live monitoring; ranks move between scans. And a grid diagnoses where you lose, not always why - that takes looking at the winners' profiles, which is what a competitor leaderboard is for.
Grid tracking in 2026: what changed
Two things. First, AI answers now sit on top of local search - BrightLocal's 2026 consumer research found 45% of consumers already use AI tools for local business recommendations, up from 6% a year earlier - but 88% of them still verify what the AI says against Google and reviews, so map-pack position keeps its value even when the first answer came from a chatbot. Second, the map pack itself has stayed remarkably stable: Google's AI Overviews appear on only about 7% of local-intent searches. The grid you win today is still where local customers convert.
What to do with your first grid
- Scan your top service keyword on a wide view - see the whole shape before zooming in.
- Find the biggest red zone inside your real service area. That's the target.
- Check the leaderboard at those red points: what do the winners have that you don't - a closer address, more recent reviews, a dedicated page for that suburb?
- Fix the cheapest gap first (usually a suburb page plus asking your customers there for reviews), then let the next scheduled scan measure whether it worked.
That loop - scan, fix, re-scan - is the entire discipline. The tools only differ in how much they charge you to run it.